
public:cb_mirror:sc_cos_survey_report_pdf_files_6389
To view this on the COS website, click here sc-cos-survey-report
To download the pdf file from the COS website, click here COS_SC_Survey_Report_1-1-18.pdf
SC COS Survey Report
Attachment: 369/COSSCSurveyReport1-1-18.pdf
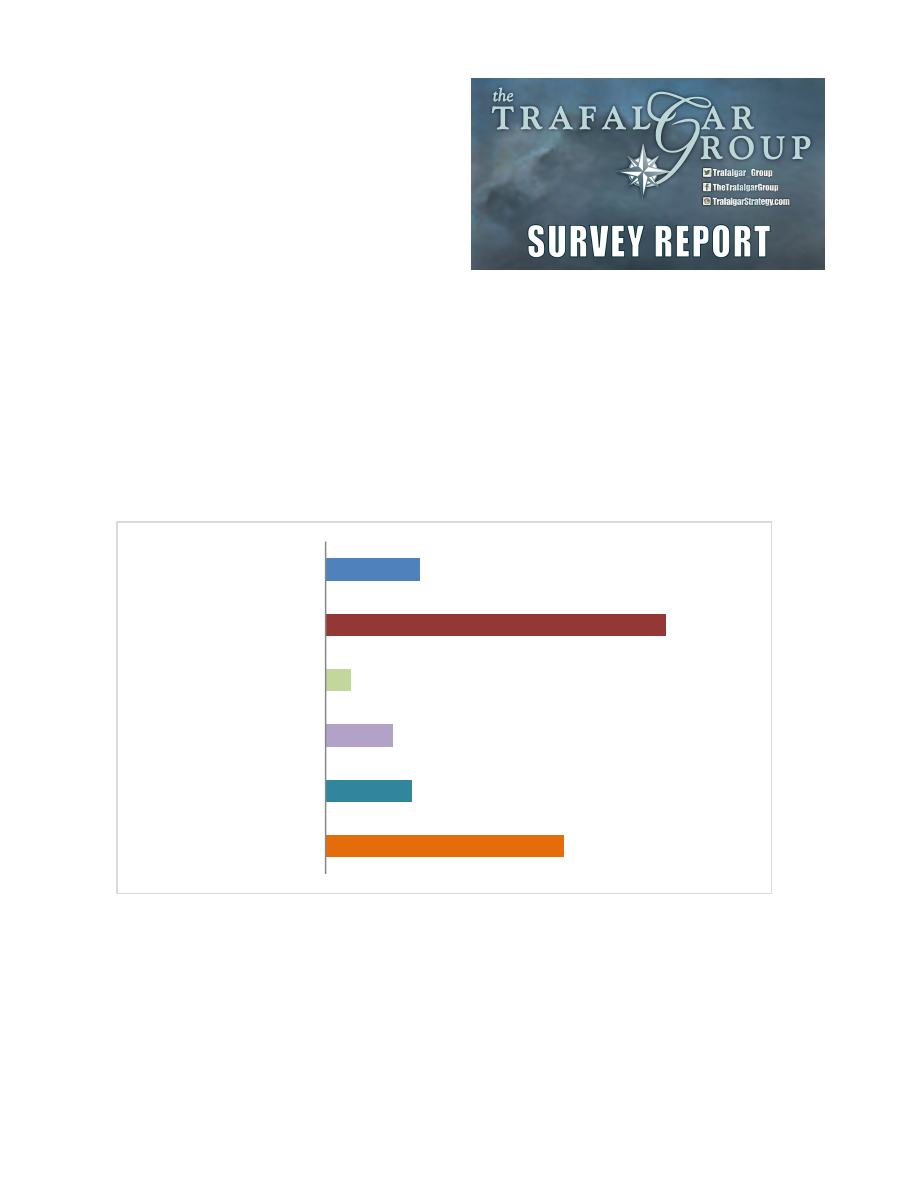 South Carolina Convention of States Survey Conducted 11/29/17-12/30/17 2,223 Respondents Likely 2018 General Election Voters Margin of Error: +/- 2.10 Response Rate: 3.71% Confidence: 95% Response Distribution: 50% Overall Survey SC Governor Among GOP Primary Voters 11.05% 39.92% 3.01% 7.92% 10.14% 27.88% Kevin Bryant Henry McMaster Yancey McGill Catherine Templeton Someone Else Undecided 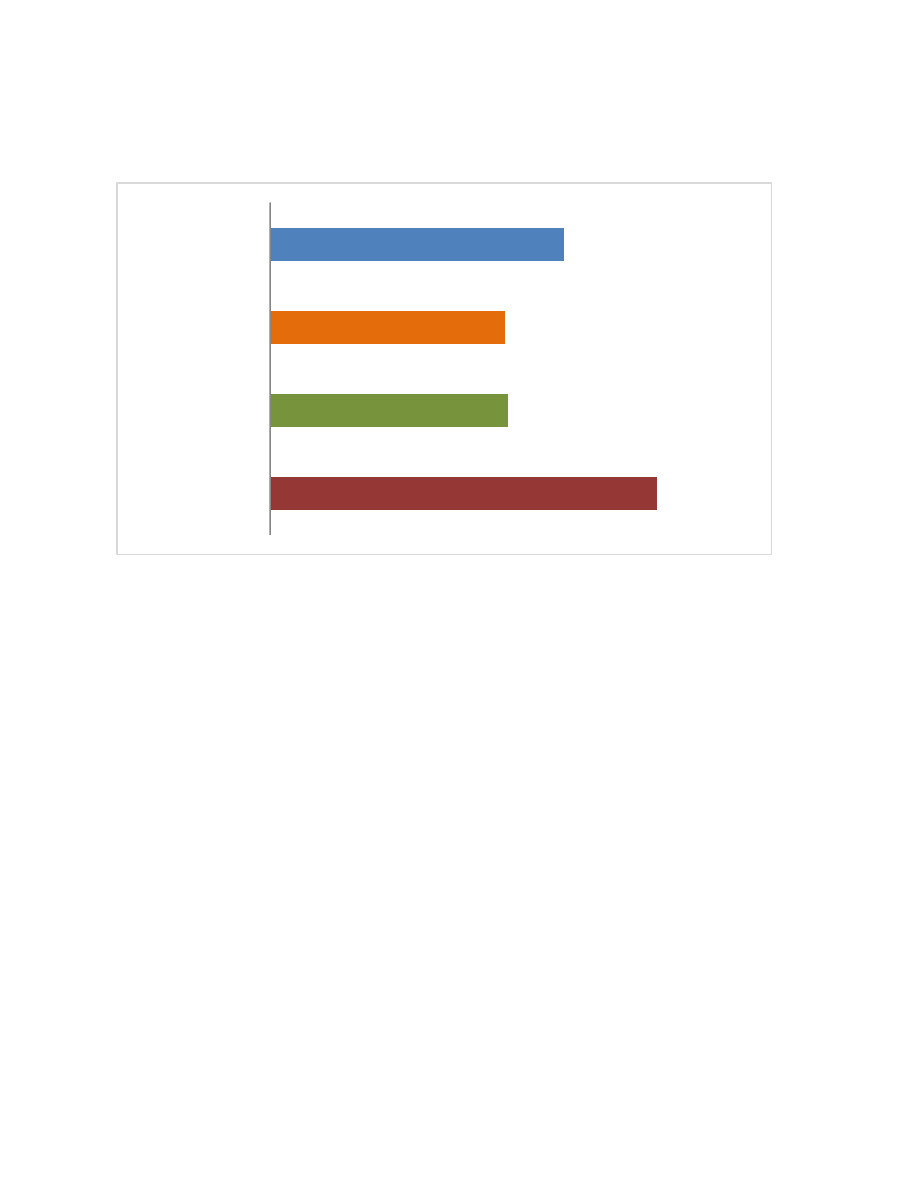 SC Governor Among DEM Primary Voters 25.47% 20.38% 20.61% 33.54% Phil Noble James Smith Someone Else Undecided 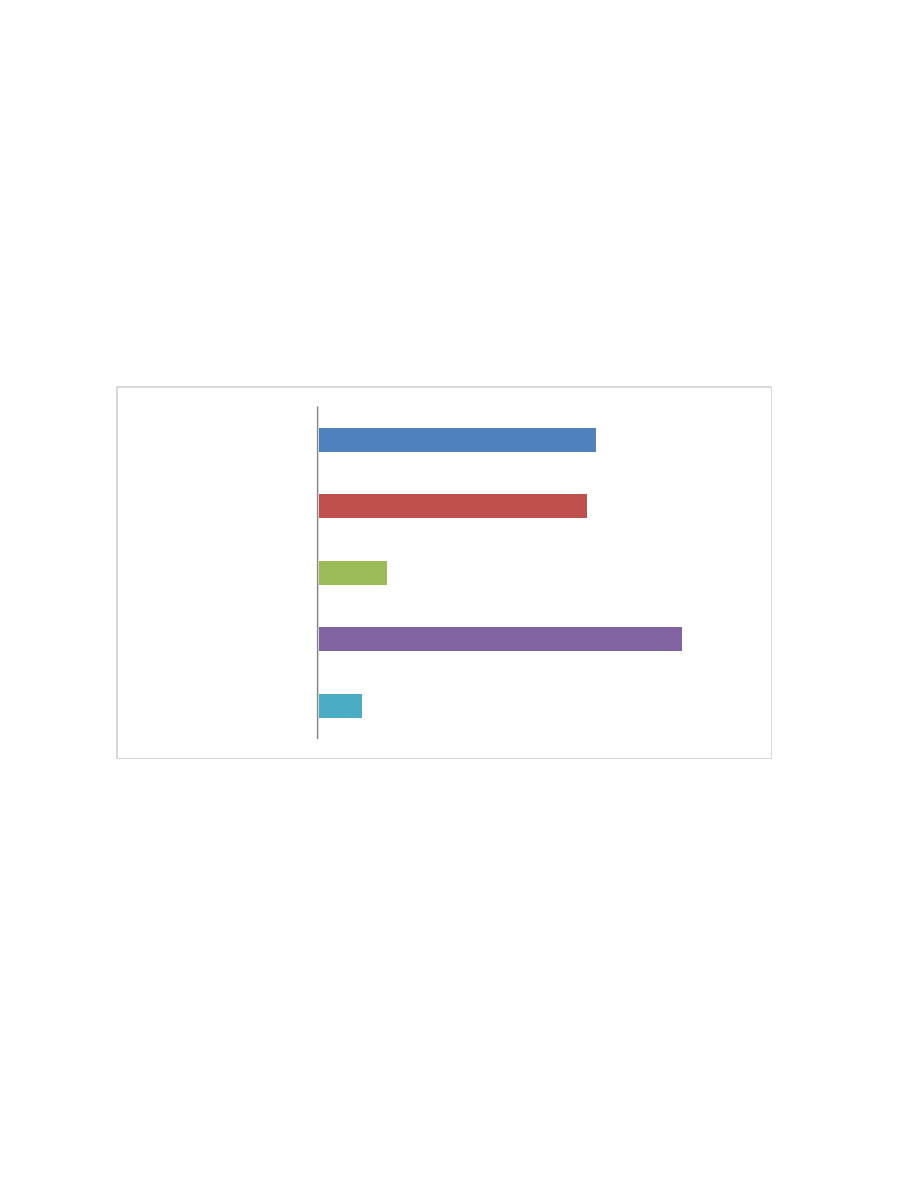 Q2: How do you feel about the way Donald Trump is handling his job as president? A. Approve B. Strongly approve C. Disapprove D. Strongly disapprove E. I have no opinion. Trump Approval 27.10% 26.26% 6.82% 35.43% 4.39% Approve Strongly Approve Disapprove Strongly Disapprove No Opinion 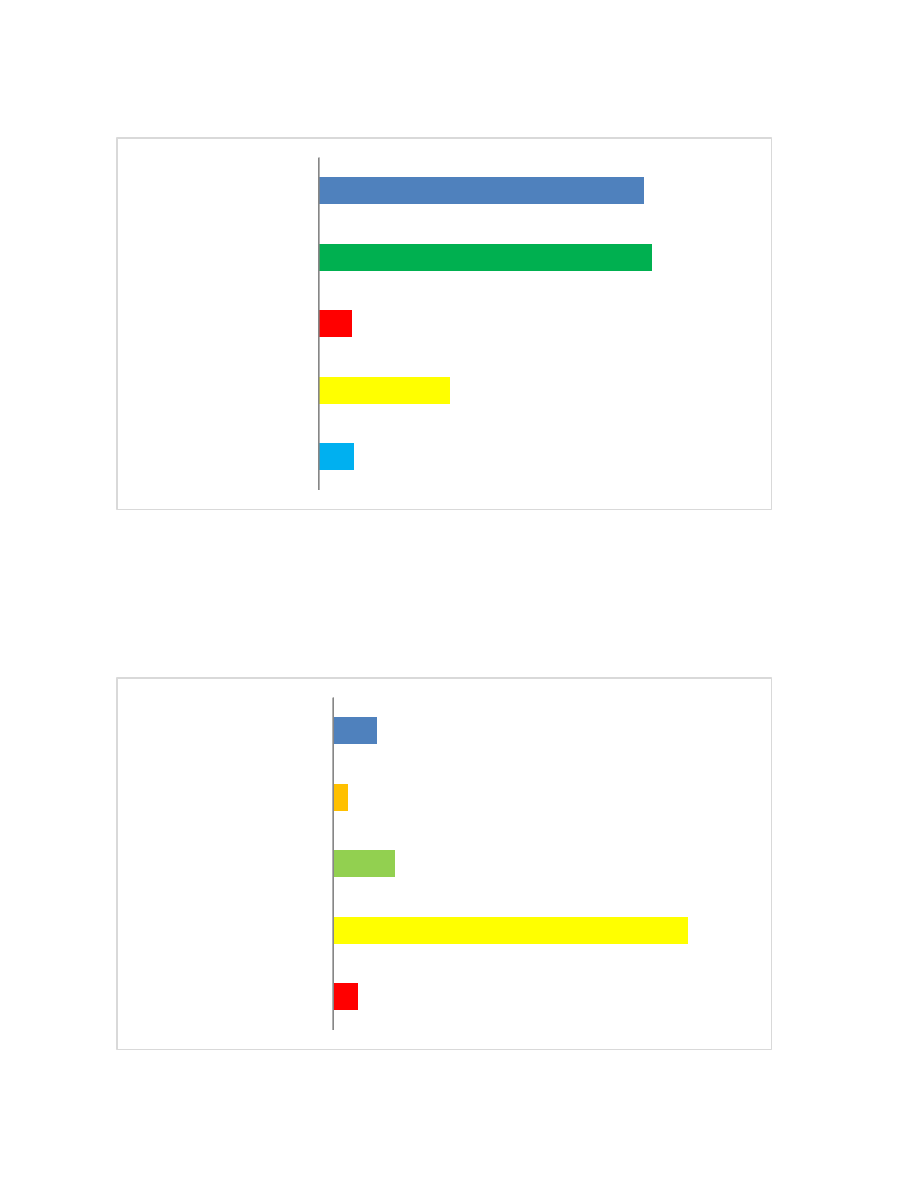 Trump Approval Among GOP Primary Voters Trump Approval Among DEM Primary Voters 37.90% 38.85% 3.90% 15.23% 4.12% Approve Strongly Approve Disapprove Strongly Disapprove No Opinion 8.56% 3.07% 12.30% 71.04% 5.03% Approve Strongly Approve Disapprove Strongly Disapprove No Opinion  Q3: What best describes your opinion of the way Congress is handling its business? A. Approve B. Strongly approve C. Disapprove D. Strongly disapprove E. I have no opinion. Congress Approval 10.14% 4.32% 34.75% 44.84% 5.93% Approve Strongly Approve Disapprove Strongly Disapprove No Opinion  Q4: What best describes your opinion of whether South Carolina should join other states in calling for a convention to propose constitutional amendments that limit federal power? A. Favor B. Strongly Favor C. Oppose D. Strongly Oppose E. Undecided Convention of States Initial Opinion 25.57% 18.61% 12.23% 11.88% 31.61% Favor Strongly Favor Oppose Strongly Oppose Undecided  Q5: What best describes your opinion of a constitutional amendment to limit federal spending? A. Favor B. Strongly Favor C. Oppose D. Strongly Oppose E. Undecided Amendment to Limit Federal Spending 27.92% 26.02% 9.96% 10.08% 26.00% Favor Strongly Favor Oppose Strongly Oppose Undecided 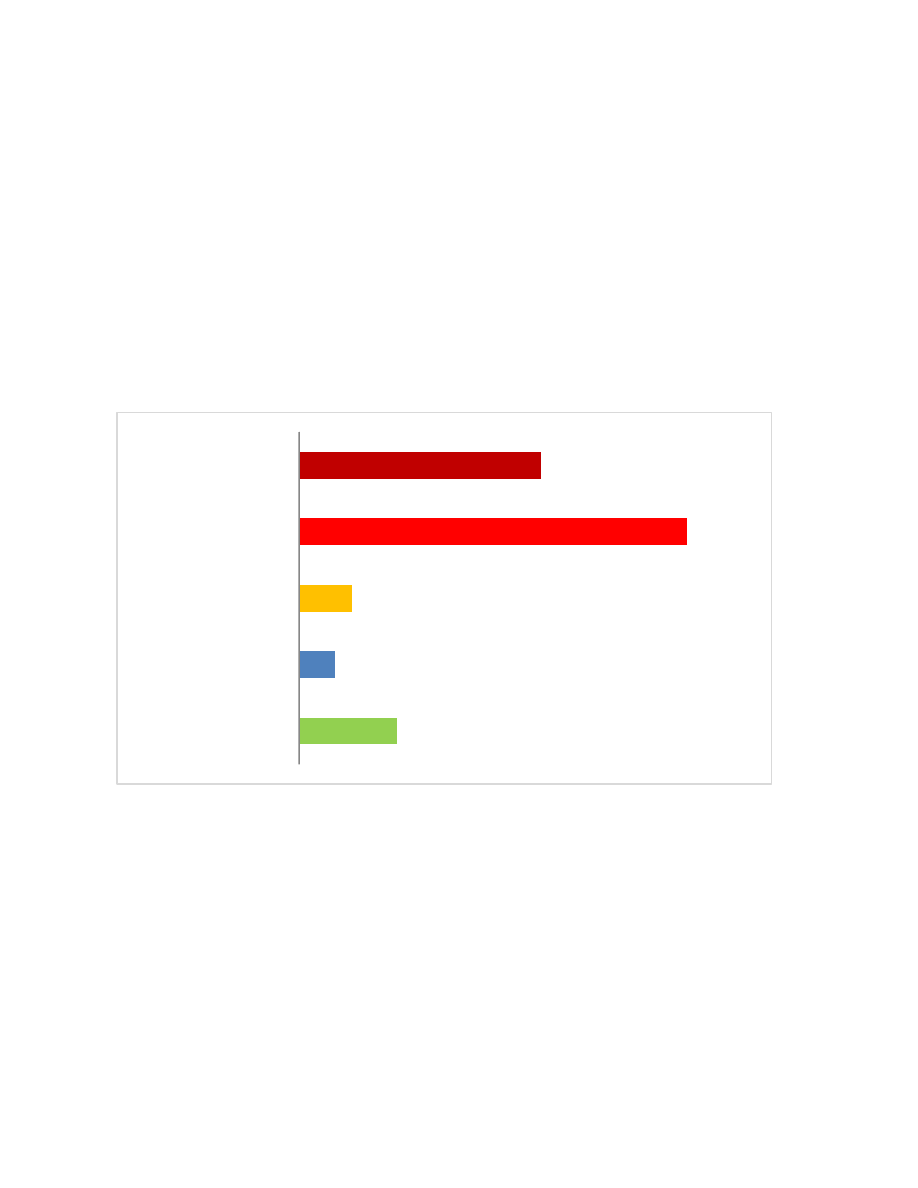 Q6: What best describes your opinion of placing term limits on members of Congress and/or federal judges? A. Favor B. Strongly Favor C. Oppose D. Strongly Oppose E. Undecided Term Limits 29.62% 47.52% 6.42% 4.33% 12.01% Favor Strongly Favor Oppose Strongly Oppose Undecided 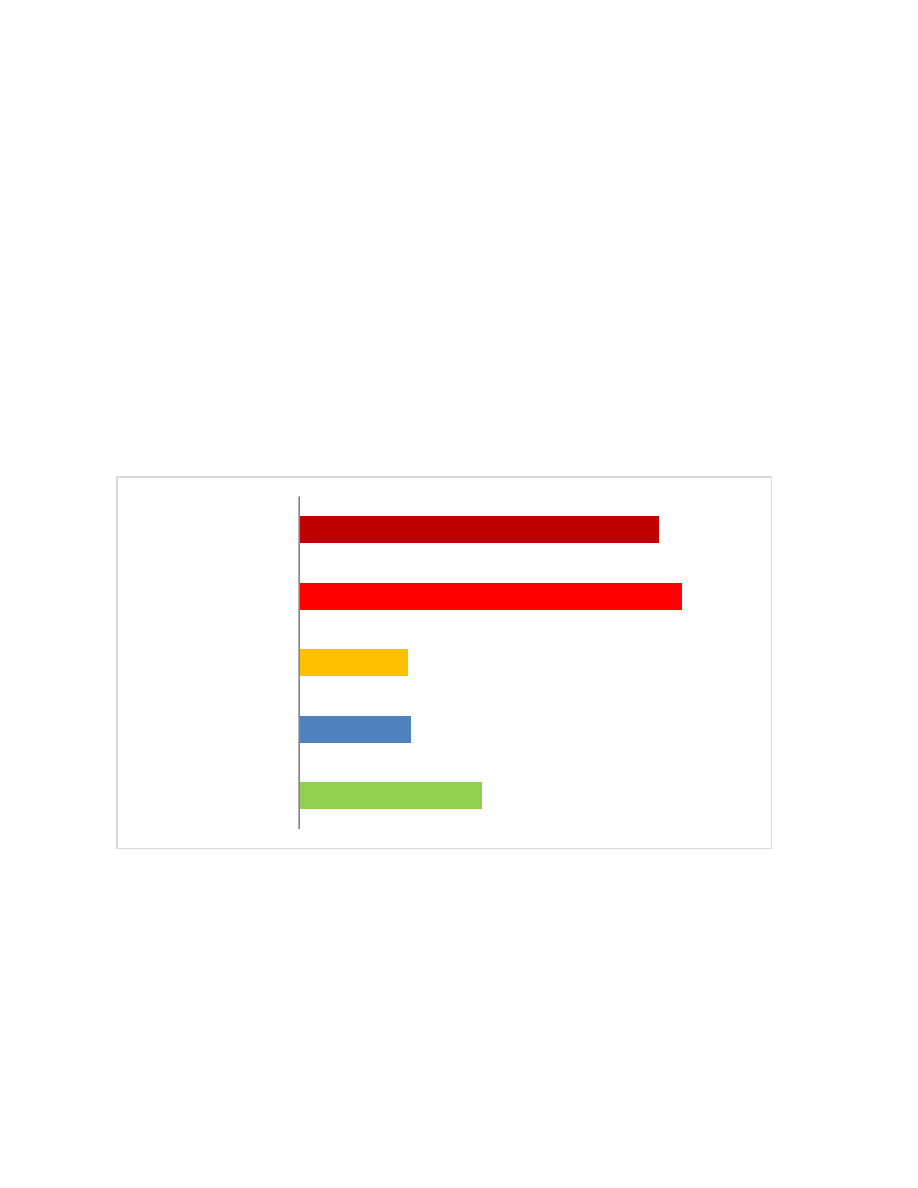 Q7: What best describes your opinion of South Carolina calling for a convention convention of states to propose constitutional amendments that limit federal spending, limit federal power, and establish term limits for members of congress and/or federal judges? A. Favor B. Strongly Favor C. Oppose D. Strongly Oppose E. Undecided Convention of States 31.36% 33.38% 9.52% 9.78% 15.92% Favor Strongly Favor Oppose Strongly Oppose Undecided 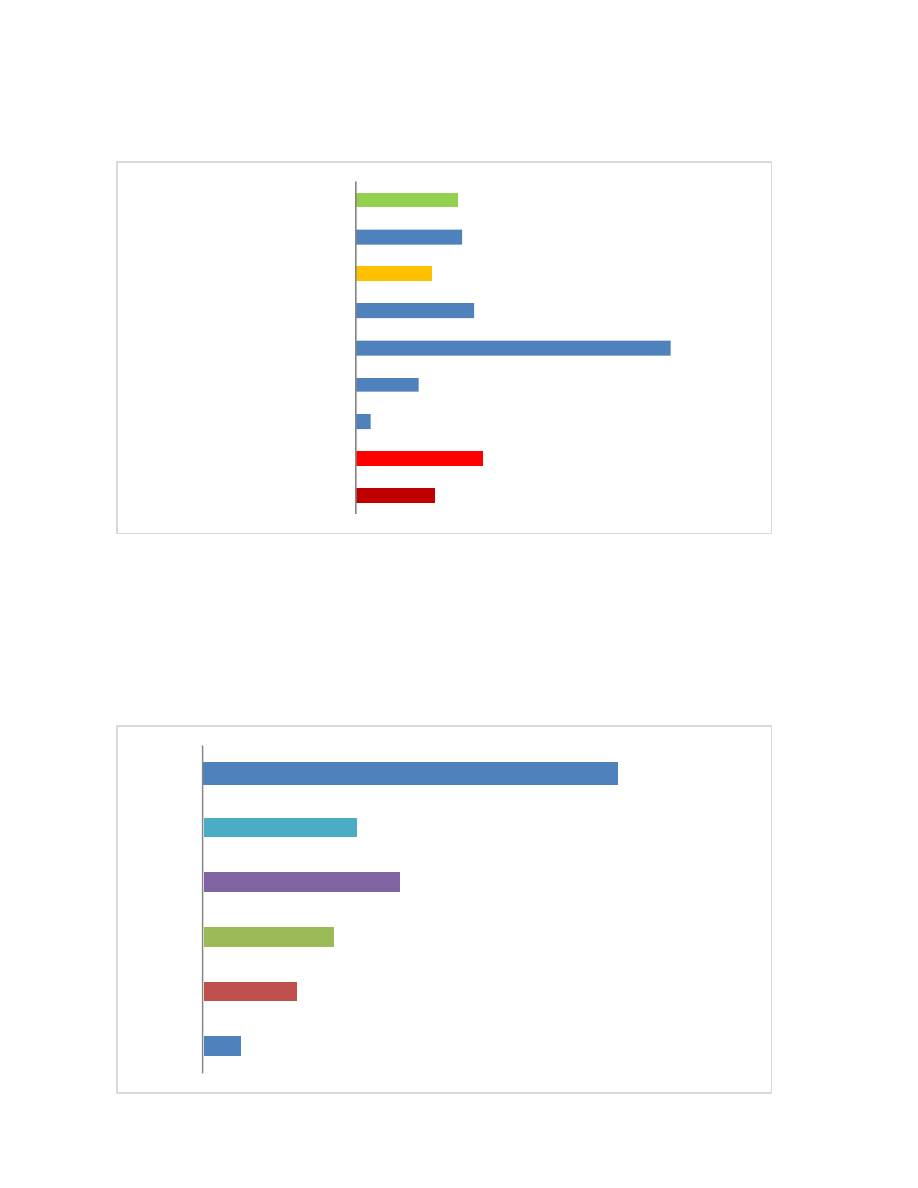 Self-Identified Ideology Age Ranges (Weighted to Match Projected South Carolina Election Participation) 10.17% 10.56% 7.54% 11.67% 31.34% 6.27% 1.50% 12.67% 7.90% Moderate Democrat Progressive Democrat Liberal Democrat Moderate Republican Conservative Republican Tea Party Republican Libertarian Independent Unsure 3.84% 9.22% 12.75% 19.19% 14.96% 40.04% 18-25 26-35 36-45 46-55 56-61 62+ 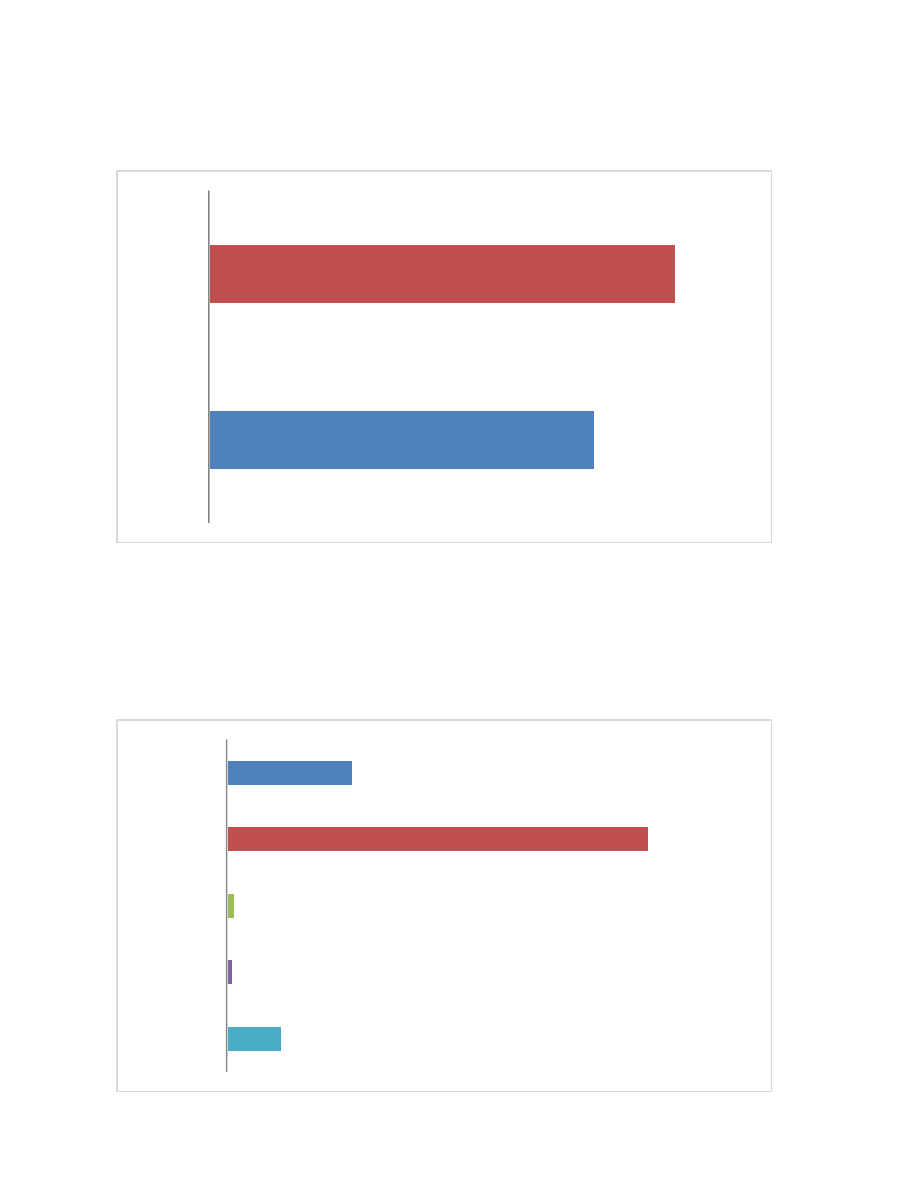 Gender (Weighted to Match Projected South Carolina Election Participation) Race/Ethnicity (Weighted to Match Projected South Carolina Election Participation) 45.23% 54.77% Male Female 20.36% 68.25% 1.43% 0.99% 8.98% Black White Latino Asian Other/ Unknown 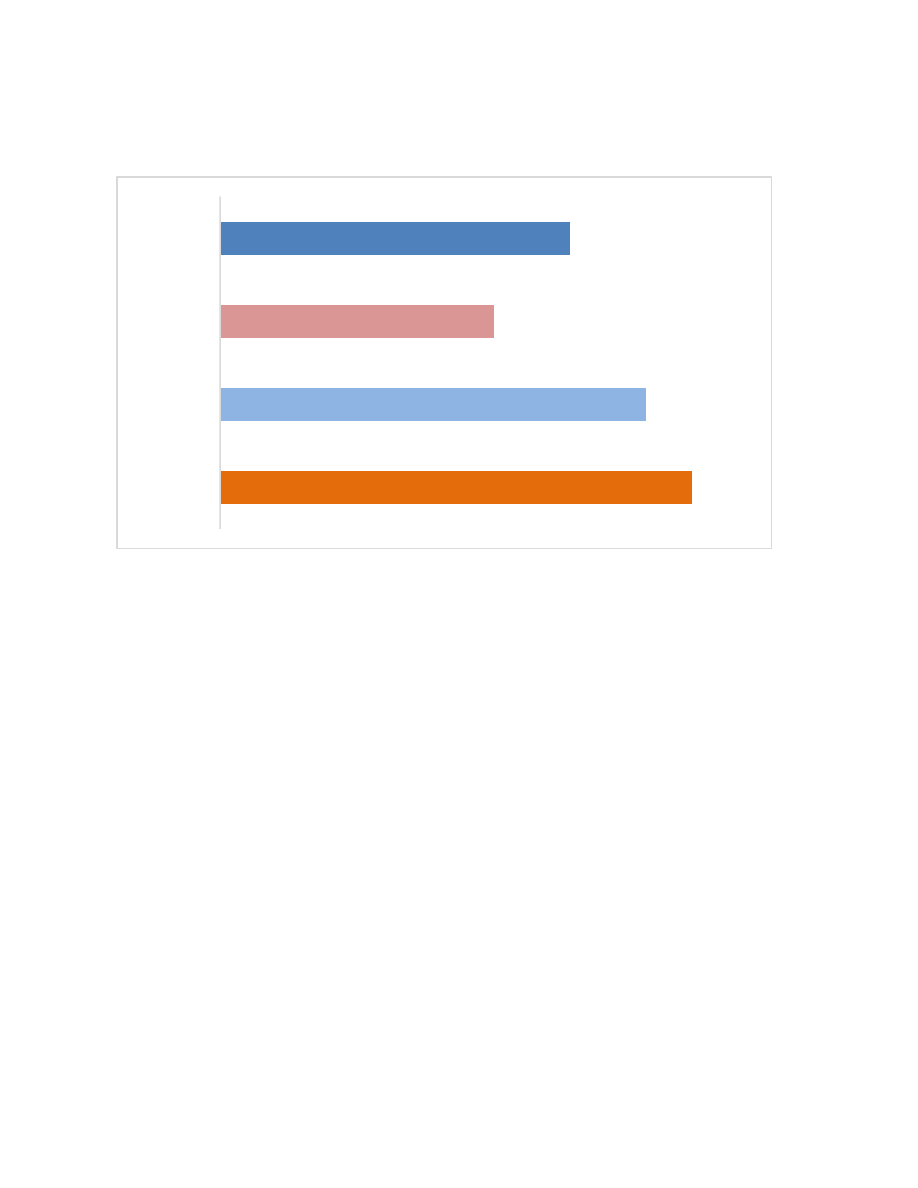 Regions (Weighted to Match Projected South Carolina Election Participation) Methodology Likely voters were selected at random from a list of registered voters based on specific election participation and registration date. Household ages and locations were extracted as well from this list. In excess of 80,000 households were contacted over the duration of the poll. Automated calls were used to contact a majority of participants, while live and online surveys were used to enrich the voter sample. A mixture of automated voice response technology, live, and online interviews are used in order to identify and compensate for possible social desirability bias. Calls are placed to randomly-selected phone numbers through a stratified process that insures approrpiate geographic representation. These calls were placed from 6:00pm to 8:30pm local time from Wednesday, November 29th though Saturday, December 30th. For more information, please contact [email protected]. Survey results undergo a weighting process to ensure the sample is comparable to the demographic breakdown of expected 2018 South Carolina general election participants. Final results are based on these weights in order to address non-response bias. 31.01% 27.98% 18.01% 23.00% Upstate Midlands Pee Dee Low Country  18-25 26-35 36-45 46-55 56-61 62+ Kevin Bryant Henry McMaster Yancey McGill Catherine Templeton Phil Noble James Smith Someone Else Undecided Male Female Upstate Midlands Pee Dee Low Country Kevin Bryant 0.00% 8.80% 8.85% 10.05% 6.06% 7.53% 100% 0% 0% 0% 0% 0% 0% 0% 7.86% 7.73% 9.61% 6.98% 7.30% 6.70% Henry McMaster 6.03% 14.29% 24.27% 31.11% 28.33% 31.42% 0% 100% 0% 0% 0% 0% 0% 0% 29.83% 25.46% 31.65% 28.65% 24.25% 22.75% Yancey McGill 9.83% 3.01% 2.90% 2.45% 4.06% 3.51% 0% 0% 100% 0% 0% 0% 0% 0% 2.94% 3.98% 2.52% 3.39% 6.38% 2.73% Catherine Templeton 29.22% 2.57% 2.76% 5.08% 7.39% 5.42% 0% 0% 0% 100% 0% 0% 0% 0% 6.92% 5.17% 6.51% 7.96% 5.25% 3.36% Phil Noble 8.36% 16.33% 11.77% 12.35% 8.78% 11.33% 0% 0% 0% 0% 100% 0% 0% 0% 11.18% 11.85% 8.70% 10.80% 14.04% 14.34% James Smith 8.36% 15.80% 8.95% 5.83% 7.02% 10.99% 0% 0% 0% 0% 0% 100% 0% 0% 8.15% 10.59% 8.37% 9.15% 8.26% 12.36% Someone Else 0.00% 5.53% 2.35% 4.29% 5.42% 3.55% 0% 0% 0% 0% 0% 0% 100% 0% 3.21% 4.41% 3.54% 4.51% 3.23% 4.01% Undecided 38.20% 33.68% 38.13% 28.85% 32.94% 26.13% 0% 0% 0% 0% 0% 0% 0% 100% 29.81% 30.81% 29.10% 28.56% 31.29% 33.52% 18-25 100% 0% 0% 0% 0% 0% 0.00% 0.85% 10.77% 18.83% 2.78% 3.39% 0.00% 4.83% 3.86% 3.83% 5.66% 2.94% 7.02% 0.00% 26-35 0% 100% 0% 0% 0% 0% 10.42% 4.80% 7.92% 3.97% 13.04% 15.36% 13.18% 10.23% 10.10% 8.49% 8.59% 11.23% 11.25% 6.04% 36-45 0% 0% 100% 0% 0% 0% 14.49% 11.28% 10.54% 5.91% 13.00% 12.03% 7.76% 16.01% 13.73% 11.93% 11.54% 15.17% 13.11% 11.15% 46-55 0% 0% 0% 100% 0% 0% 24.75% 21.76% 13.38% 16.34% 20.52% 11.78% 21.30% 18.23% 18.75% 19.55% 20.55% 18.90% 16.36% 19.91% 56-61 0% 0% 0% 0% 100% 0% 11.65% 15.45% 17.34% 18.54% 11.38% 11.07% 20.98% 16.24% 13.93% 15.82% 13.19% 13.97% 16.87% 17.07% 62+ 0% 0% 0% 0% 0% 100% 38.69% 45.86% 40.05% 36.41% 39.29% 46.38% 36.78% 34.46% 39.63% 40.38% 40.46% 37.80% 35.38% 45.83% Male 45.39% 49.55% 48.73% 44.20% 42.11% 44.77% 45.63% 49.18% 37.89% 52.47% 43.80% 38.87% 37.53% 44.41% 100% 0% 50.58% 43.76% 39.13% 44.59% Female 54.61% 50.45% 51.27% 55.80% 57.89% 55.23% 54.37% 50.82% 62.11% 47.53% 56.20% 61.13% 62.47% 55.59% 0% 100% 49.42% 56.24% 60.87% 55.41% Upstate 45.71% 28.89% 28.08% 33.22% 27.35% 31.34% 38.25% 35.78% 22.26% 33.85% 23.37% 27.36% 28.43% 29.73% 34.68% 27.98% 100% 0% 0% 0% Midlands 21.39% 34.06% 33.28% 27.56% 26.11% 26.42% 25.06% 29.22% 27.07% 37.35% 26.16% 26.99% 32.63% 26.32% 27.07% 28.73% 0% 100% 0% 0% Pee Dee 32.90% 21.98% 18.53% 15.36% 20.31% 15.92% 16.89% 15.92% 32.75% 15.84% 21.91% 15.67% 15.06% 18.56% 15.58% 20.02% 0% 0% 100% 0% Low Country 0.00% 15.06% 20.11% 23.87% 26.23% 26.32% 19.80% 19.08% 17.92% 12.96% 28.56% 29.97% 23.88% 25.39% 22.67% 23.27% 0% 0% 0% 100% South Carolina Convention of States Survey Report Crosstabs APPENDIX CROSSTABS OVERALL & BALLOT TEST  18-25 26-35 36-45 46-55 56-61 62+ Republican Democrat Male Female Upstate Midlands Pee Dee Low Country Approve 23.24% 18.37% 24.49% 29.72% 24.04% 30.20% 37.17% 8.93% 27.44% 26.82% 28.17% 28.05% 26.71% 24.81% Strongly Approve 15.36% 21.10% 21.76% 31.69% 30.31% 25.81% 39.08% 3.13% 27.20% 25.48% 27.74% 26.66% 25.62% 24.26% Disapprove 19.59% 3.98% 4.23% 4.80% 7.99% 7.61% 4.06% 11.81% 7.55% 6.22% 7.10% 6.74% 7.36% 6.12% Strongly Disapprove 41.81% 51.91% 41.83% 31.58% 32.90% 31.77% 15.66% 71.10% 33.44% 37.07% 31.13% 34.35% 36.18% 41.94% No Opinion 0.00% 4.63% 7.69% 2.21% 4.74% 4.62% 4.03% 5.04% 4.36% 4.42% 5.85% 4.20% 4.12% 2.87% Q2: How do you feel about the way Donald Trump is handling his job as president? A. Approve B. Strongly approve C. Disapprove D. Strongly disapprove E. I have no opinion. APPENDIX CROSSTABS TRUMP APPROVAL  18-25 26-35 36-45 46-55 56-61 62+ Republican Democrat Male Female Upstate Midlands Pee Dee Low Country Approve 0.00% 11.08% 11.20% 12.01% 7.35% 10.70% 13.79% 3.55% 10.38% 9.93% 10.91% 9.48% 12.84% 7.77% Strongly Approve 6.03% 3.02% 2.23% 1.98% 4.17% 6.29% 4.98% 3.12% 4.65% 4.04% 3.59% 6.20% 2.43% 4.49% Disapprove 13.11% 41.84% 31.10% 34.84% 38.97% 34.73% 38.20% 28.51% 36.45% 33.34% 38.02% 35.62% 34.21% 29.69% Strongly Disapprove 80.86% 39.77% 43.46% 48.81% 43.38% 41.62% 36.74% 59.45% 42.41% 46.84% 40.67% 44.08% 44.68% 51.49% No Opinion 0.00% 4.29% 12.00% 2.37% 6.13% 6.57% 6.24% 5.37% 6.11% 5.78% 6.81% 4.61% 5.64% 6.56% Q3: What best describes your opinion of the way Congress is handling its business? A. Approve B. Strongly approve C. Disapprove D. Strongly disapprove E. I have no opinion. APPENDIX CROSSTABS CONGRESS APPROVAL  18-25 26-35 36-45 46-55 56-61 62+ Republican Democrat Male Female Upstate Midlands Pee Dee Low Country Favor 9.83% 26.12% 28.89% 28.81% 21.04% 26.03% 30.67% 16.36% 26.18% 25.06% 27.73% 26.83% 26.27% 20.56% Strongly Favor 27.12% 13.17% 15.61% 25.72% 23.32% 14.84% 23.37% 10.02% 19.30% 18.04% 16.80% 20.82% 18.15% 18.73% Oppose 0.00% 20.61% 9.38% 10.40% 14.70% 12.34% 11.64% 13.31% 12.10% 12.34% 12.33% 10.82% 12.55% 13.57% Strongly Oppose 12.39% 8.84% 18.63% 11.59% 13.75% 9.83% 6.67% 21.29% 13.72% 10.36% 13.08% 11.28% 7.89% 14.12% Undecided 50.65% 31.26% 27.48% 23.48% 27.19% 36.73% 27.50% 39.03% 28.61% 34.10% 30.06% 30.24% 34.93% 32.78% Q4: What best describes your opinion of whether South Carolina should join other states in calling for a convention to propose constitutional amendments that limit federal power? A. Favor B. Strongly Favor C. Oppose D. Strongly Oppose E. Undecided APPENDIX CROSSTABS CONVENTION OF STATES INITIAL OPINION  18-25 26-35 36-45 46-55 56-61 62+ Republican Democrat Male Female Upstate Midlands Pee Dee Low Country Favor 37.95% 24.74% 28.71% 30.27% 27.06% 26.63% 33.47% 17.91% 29.21% 26.86% 29.40% 28.08% 27.98% 25.70% Strongly Favor 36.96% 28.00% 25.21% 31.60% 26.44% 21.94% 31.84% 15.50% 27.42% 24.86% 27.55% 26.26% 25.23% 24.26% Oppose 6.35% 13.71% 7.32% 10.75% 10.76% 9.61% 6.73% 15.79% 10.09% 9.86% 10.82% 9.68% 9.86% 9.22% Strongly Oppose 12.39% 10.52% 14.49% 8.87% 12.05% 8.19% 5.07% 19.11% 11.22% 9.14% 9.73% 8.91% 7.87% 13.70% Undecided 6.35% 23.02% 24.26% 18.52% 23.69% 33.57% 22.85% 31.69% 22.02% 29.28% 22.50% 27.07% 28.93% 27.12% Q5: What best describes your opinion of a constitutional amendment to limit federal spending? A. Favor B. Strongly Favor C. Oppose D. Strongly Oppose E. Undecided APPENDIX CROSSTABS AMENDMENT TO LIMIT FEDERAL SPENDING  18-25 26-35 36-45 46-55 56-61 62+ Republican Democrat Male Female Upstate Midlands Pee Dee Low Country Favor 27.59% 20.99% 29.44% 31.49% 30.81% 30.53% 31.55% 26.15% 30.66% 28.77% 37.94% 28.98% 21.76% 25.36% Strongly Favor 53.67% 55.46% 46.91% 50.24% 49.59% 43.23% 52.15% 39.17% 45.95% 48.82% 42.01% 50.91% 52.14% 47.23% Oppose 0.00% 10.80% 6.95% 4.46% 5.28% 7.22% 5.61% 7.88% 7.79% 5.29% 5.36% 6.08% 7.36% 7.53% Strongly Oppose 0.00% 3.67% 5.47% 4.25% 4.35% 4.58% 1.90% 8.73% 4.07% 4.55% 3.68% 4.82% 2.95% 5.71% Undecided 18.74% 9.08% 11.23% 9.57% 9.97% 14.21% 8.65% 18.07% 11.43% 12.48% 10.87% 9.13% 15.66% 14.17% Q6: What best describes your opinion of placing term limits on members of Congress and/or federal judges? A. Favor B. Strongly Favor C. Oppose D. Strongly Oppose E. Undecided APPENDIX CROSSTABS TERM LIMITS  18-25 26-35 36-45 46-55 56-61 62+ Republican Democrat Male Female Upstate Midlands Pee Dee Low Country Favor 27.59% 30.52% 30.07% 31.76% 25.70% 34.24% 34.55% 25.60% 31.48% 31.25% 36.15% 31.86% 23.56% 30.39% Strongly Favor 53.67% 28.19% 33.90% 35.54% 38.47% 29.52% 38.48% 24.16% 33.22% 33.50% 29.74% 35.26% 40.44% 30.46% Oppose 0.00% 17.65% 6.49% 10.31% 9.57% 9.14% 7.93% 12.40% 10.42% 8.78% 8.85% 8.77% 11.89% 9.49% Strongly Oppose 12.39% 8.81% 14.61% 9.15% 9.64% 8.58% 5.93% 16.73% 10.54% 9.16% 10.31% 10.16% 7.01% 10.78% Undecided 6.35% 14.82% 14.93% 13.25% 16.61% 18.42% 13.05% 21.10% 14.24% 17.30% 14.95% 13.88% 16.97% 18.89% Q7: What best describes your opinion of South Carolina calling for a convention convention of states to propose constitutional amendments that limit federal spending, limit federal power, and establish term limits for members of congress and/or federal judges? A. Favor B. Strongly Favor C. Oppose D. Strongly Oppose E. Undecided APPENDIX CROSSTABS CONVENTION OF STATES |
| Page Metadata | |
| Login Required to view? | No |
| Created: | 2018-04-29 01:28 GMT |
| Updated: | 2019-04-29 03:00 GMT |
| Published: | 2018-04-29 00:00 GMT |
| Converted: | 2025-11-11 12:10 GMT |
| Change Author: | Amy Neely |
| Credit Author: | |
public/cb_mirror/sc_cos_survey_report_pdf_files_6389.txt · Last modified: 2025/11/11 12:10 by 127.0.0.1